New research on social media during the 2020 election, and my predictions
This is crossposted from Statistical Modeling, Causal Inference, and Social Science.
Back in 2020, leading academics and researchers at the company now known as Meta put together a large project to study social media and the 2020 US elections — particularly the roles of Instagram and Facebook. As Sinan Aral and I had written about how many paths for understanding effects of social media in elections could require new interventions and/or platform cooperation, this seemed like an important development. Originally the idea was for this work to be published in 2021, but there have been some delays, including simply because some of the data collection was extended as what one might call “election-related events” continued beyond November and into 2021. As of 2pm Eastern today, the news embargo for this work has been lifted on the first group of research papers.
I had heard about this project back a long time ago and, frankly, had largely forgotten about it. But this past Saturday, I was participating in the SSRC Workshop on the Economics of Social Media and one session was dedicated to results-free presentations about this project, including the setup of the institutions involved and the design of the research. The organizers informally polled us with qualitative questions about some of the results. This intrigued me. I had recently reviewed an unrelated paper that included survey data from experts and laypeople about their expectations about the effects estimated in a field experiment, and I thought this data was helpful for contextualizing what “we” learned from that study.
So I thought it might be useful, at least for myself, to spend some time eliciting my own expectations about the quantities I understood would be reported in these papers. I’ve mainly kept up with the academic and grey literature, I’d previously worked in the industry, and I’d reviewed some of this for my Senate testimony back in 2021. Along the way, I tried to articulate where my expectations and remaining uncertainty were coming from. I composed many of my thoughts on my phone Monday while taking the subway to and from the storage unit I was revisiting and then emptying in Brooklyn. I got a few comments from Solomon Messing and Tom Cunningham, and then uploaded my notes to OSF and posted a cheeky tweet.
Since then, starting yesterday, I’ve spoken with journalists and gotten to view the main text of papers for two of the randomized interventions for which I made predictions. These evaluated effects of (a) switching Facebook and Instagram users to a (reverse) chronological feed, (b) removing “reshares” from Facebook users’ feeds, and (c) downranking content by “like-minded” users, Pages, and Groups.
My guesses
My main expectations for those three interventions could be summed up as follows. These interventions, especially chronological ranking, would each reduce engagement with Facebook or Instagram. This makes sense if you think the status quo is somewhat-well optimized for showing engaging and relevant content. So some of the rest of the effects — on, e.g., polarization, news knowledge, and voter turnout — could be partially inferred from that decrease in use. This would point to reductions in news knowledge, issue polarization (or coherence/consistency), and small decreases in turnout, especially for chronological ranking. This is because people get some hard news and political commentary they wouldn’t have otherwise from social media. These reduced-engagement-driven effects should be weakest for the “soft” intervention of downranking some sources, since content predicted to be particularly relevant will still make it into users’ feeds.
Besides just reducing Facebook use (and everything that goes with that), I also expected swapping out feed ranking for reverse chron would expose users to more content from non-friends via, e.g., Groups, including large increases in untrustworthy content that would normally rank poorly. I expected some of the same would happen from removing reshares, which I expected would make up over 20% of views under the status quo, and so would be filled in by more Groups content. For downranking sources with the same estimated ideology, I expected this would reduce exposure to political content, as much of the non-same-ideology posts will be by sources with estimated ideology in the middle of the range, i.e. [0.4, 0.6], which are less likely to be posting politics and hard news. I’ll also note that much of my uncertainty about how chronological ranking would perform was because there were a lot of unknown but important “details” about implementation, such as exactly how much of the ranking system really gets turned off (e.g., how much likely spam/scam content still gets filtered out in an early stage?).
How’d I do?
Here’s a quick summary of my guesses and the results in these three papers:
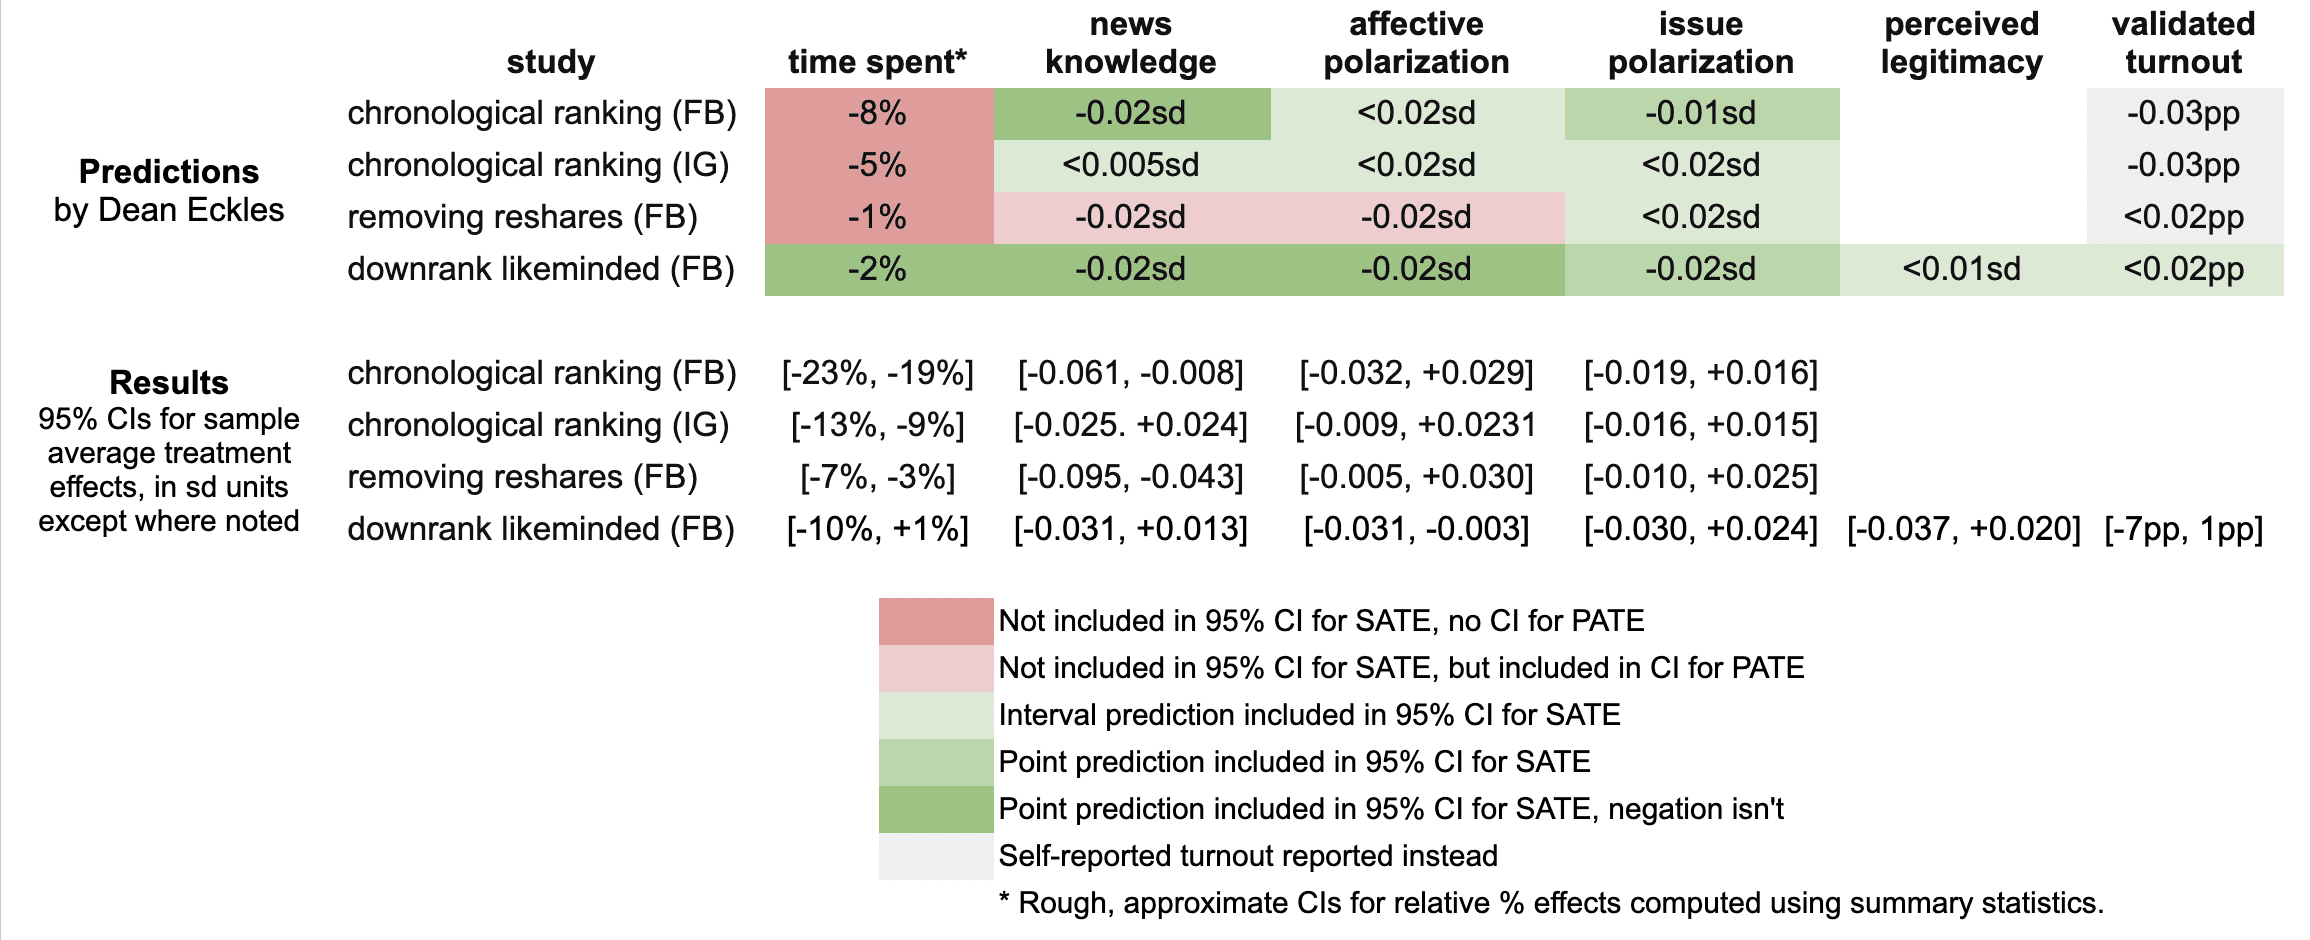
It looks like I was wrong in that the reductions in engagement were larger than I predicted: e.g., chronological ranking reduced time spent on Facebook by 21%, rather than the 8% I guessed, which was based on my background knowledge, a leaked report on a Facebook experiment, and this published experiment from Twitter.
Ex post I hypothesize that this is because of the duration of these experiments allowed for continual declines in use over months, with various feedback loops (e.g., users with chronological feed log in less, so they post less, so they get fewer likes and comments, so they log in even less and post even less). As I dig into the 100s of pages of supplementary materials, I’ll be looking to understand what these declines looked like at earlier points in the experiment, such as by election day.
My estimates for the survey-based outcomes of primary interest, such as polarization, were mainly covered by the 95% confidence intervals, with the exception of two outcomes from the “no reshares” intervention.
One thing is that all these papers report weighted estimates for a broader population of US users (population average treatment effects, PATEs), which are less precise than the unweighted (sample average treatment effect, SATE) results. Here I focus mainly on the unweighted results, as I did not know there was going to be any weighting and these are also the more narrow, and thus riskier, CIs for me. (There seems to have been some mismatch between the outcomes listed in the talk I saw and what’s in the papers, so I didn’t make predictions for some reported primary outcomes and some outcomes I made predictions for don’t seem to be reported, or I haven’t found them in the supplements yet.)
Now is a good time to note that I basically predicted what psychologists armed with Jacob Cohen’s rules of thumb might call extrapolate to “minuscule” effect sizes. All my predictions for survey-based outcomes were 0.02 standard deviations or smaller. (Recall Cohen’s rules of thumb say 0.1 is small, 0.5 medium, and 0.8 large.)
Nearly all the results for these outcomes in these two papers were indistinguishable from the null (p > 0.05), with standard errors for survey outcomes at 0.01 SDs or more. This is consistent with my ex ante expectations that the experiments would face severe power problems, at least for the kind of effects I would expect. Perhaps by revealed preference, a number of other experts had different priors.
A rare p < 0.05 result is that that chronological ranking reduced news knowledge by 0.035 SDs with 95% CI [-0.061, -0.008], which includes my guess of -0.02 SDs. Removing reshares may have reduced news knowledge even more than chronological ranking — and by more than I guessed.
Even with so many null results I was still sticking my neck out a bit compared with just guessing zero everywhere, since in some cases if I had put the opposite sign my estimate wouldn’t have been in the 95% CI. For example, downranking “like-minded” sources produced a CI of [-0.031, 0.013] SDs, which includes my guess of -0.02, but not its negation. On the other hand, I got some of these wrong, where I guessed removing reshares would reduce affective polarization, but a 0.02 SD effect is outside the resulting [-0.005, +0.030] interval.
It was actually quite a bit of work to compare my predictions to the results because I didn’t really know a lot of key details about exact analyses and reporting choices, which strikingly even differ a bit across these three papers. So I might yet find more places where I can, with a lot of reading and a bit of arithmetic, figure out where else I may have been wrong. (Feel free to point these out.)
Further reflections
I hope that this helps to contextualize the present results with expert consensus — or at least my idiosyncratic expectations. I’ll likely write a bit more about these new papers and further work released as part of this project.
It was probably an oversight for me not to make any predictions about the observational paper looking at polarization in exposure and consumption of news media. I felt like I had a better handle on thinking about simple treatment effects than these measures, but perhaps that was all the more reason to make predictions. Furthermore, given the limited precision of the experiments’ estimates, perhaps it would have been more informative (and riskier) to make point predictions about these precisely estimated observational quantities.
[I want to note that I was an employee or contractor of Facebook (now Meta) from 2010 through 2017. I have received funding for other research from Meta, Meta has sponsored a conference I organize, and I have coauthored with Meta employees as recently as earlier this month. I was also recently a consultant to Twitter, ending shortly after the Musk acquisition. You can find all my disclosures here.]
The “friendly world syndrome” induced by simple filtering rules
I’ve written previously about how filtered activity streams [edit: i.e. news feeds] can lead to biased views of behaviors in our social neighborhoods. Recent conversations with two people writing popular-press books on related topics have helped me clarify these ideas. Here I reprise previous comments on filtered activity streams, aiming to highlight how they apply even in the case of simple and transparent personalization rules, such as those used by Twitter.
—
Birds of a feather flock together. Once flying together, a flock is also subject to the same causes (e.g., storms, pests, prey). Our friends, family, neighbors, and colleagues are more similar to us for similar reasons (and others). So we should have no illusions that the behaviors, attitudes, outcomes, and beliefs of our social neighborhood are good indicators of those of other populations — like U.S. adults, Internet users, or homo sapiens of the past, present, or future. The apocryphal Pauline Kael quote “How could Nixon win? No one I know voted for him” suggests both the ease and error of this kind of inference. I take it as a given that people’s estimates of larger populations’ behaviors and beliefs are often biased in the direction of the behaviors and beliefs in their social neighborhoods. This is the case with and without “social media” and filtered activity streams — and even mediated communication in general.
That is, even without media, our personal experiences are not “representative” of the American experience, human experience, etc., but we do (and must) rely on it anyway. One simple cognitive tool here is using “ease of retrieval” to estimate how common or likely some event is: we can estimate how common something is based on how easy it is to think of. So if something prompts someone to consider how common a type of event is, they will (on average) estimate the event as more common if it is more easy to think of an example of the event, imagine the event, etc. And our personal experiences provide these examples and determine how easy they are to bring to mind. Both prompts and immediately prior experience can thus affect these frequency judgments via ease of retrieval effects.
Now this is not to say that we should think as ease of retrieval heuristics as biases per se. Large classes and frequent occurrences are often more available to mind than those that are smaller or less frequent. It is just that this is also often not the case, especially when there is great diversity in frequency among physical and social neighborhoods. But certainly we can see some cases where these heuristics fail.
Media are powerful sources of experiences that can make availability and actual frequency diverge, whether by increasing the biases in the direction of projecting our social neighborhoods onto larger population or in other, perhaps unexpected directions. In a classic and controversial line of research in the 1970s and 80s, Gerbner and colleagues argued that increased television-watching produces a “mean world syndrome” such that watching more TV causes people to increasingly overestimate, e.g., the fraction of adult U.S. men employed in law enforcement and the probability of being a victim of violent crime. Their work did not focus on investigating heuristics producing these effects, but others have suggested the availability heuristic (and related ease of retrieval effects) as at work. So even if my social neighborhood has fewer cops or victims of violent crime than the national average, media consumption and the availability heuristic can lead me to overestimate both.
Personalized and filtered activity streams certainly also affect us through some of the same psychological processes, leading to biases in users’ estimates of population-wide frequencies. They can aIso bias inference about our own social neighborhoods. If I try to estimate how likely a Facebook status update by a friend is to receive a comment, this estimate will be affected by the status updates I have seen recently. And if content with comments is more likely to be shown to me in my personalized filtered activity stream (a simple rule for selecting more interesting content, when there is too much for me to consume it all), then it will be easier for me to think of cases in which status updates by my friends do receive comments.
In my previous posts on these ideas, I have mainly focused on effects on beliefs about my social neighborhood and specifically behaviors and outcomes specific to the service providing the activity stream (e.g., receiving comments). But similar effects apply for beliefs about other behaviors, opinions, and outcomes. In particular, filtered activity streams can increase the sense that my social neighborhood (and perhaps the world) agrees with me. Say that content produced by my Facebook friends with comments and interaction from mutual friends is more likely to be shown in my filtered activity streams. Also assume that people are more likely to express their agreement in such a way than substantial disagreement. As long as I am likely to agree with most of my friends, then this simple rule for filtering produces an activity stream with content I agree with more than an unfiltered stream would. Thus, even if I have a substantial minority of friends with whom I disagree on politics, this filtering rule would likely make me see less of their content, since it is less likely to receive (approving) comments from mutual friends.
I’ve been casually calling this larger family of effects this the “friendly world syndrome” induced by filtered activity streams. Like the mean world syndrome of the television cultivation research described above, this picks out a family of unintentional effects of media. Unlike the mean world syndrome, the friendly world syndrome includes such results as overestimating how many friends I have in common with my friends, how much positive and accomplishment-reporting content my friends produce, and (as described) how much I agree with my friends. ((This might suggest that some of the false consensus effects observed in recent work using data collected about Facebook friends could be endogenous to Facebook. See Goel, S., Mason, W., & Watts, D. J. (2010). Real and perceived attitude agreement in social networks. Journal of Personality and Social Psychology, 99(4), 611-621. doi:10.1037/a0020697))
Even though the filtering rules I’ve described so far are quite simple and appealing, they still are more consistent with versions of activity streams that are filtered by fancy relevance models, which are often quite opaque to users. Facebook News Feed — and “Top News” in particular — is the standard example here. On the other hand, one might think that these arguments do not apply to Twitter, which does not apply any kind of machine learning model estimating relevance to filtering users’ streams. But Twitter actually does implement a filtering rule with important similarities to the “comments from mutual friends” rule described above. Twitter only shows “@replies” to a user on their home page when that user is following both the poster of the reply and the person being replied to. ((Twitter offers the option to see all @replies written by people one is following, but 98% of users use the default option. Some users were unhappy with an earlier temporary removal of this feature. My sense is that the biggest complaint was that removing this feature removed a valuable means for discovering new people to follow.)) This rule makes a lot of sense, as a reply is often quite difficult to understand without the original tweet. Thus, I am much more likely to see people I follow replying to people I follow than to others (since the latter replies are encountered only from browsing away from the home page. I think this illustrates how even a straightforward, transparent rule for filtering content can magnify false consensus effects.
One aim in writing this is to clarify that a move from filtering activity streams using opaque machine learning models of relevance to filtering them with simple, transparent, user-configurable rules will likely be insufficient to prevent the friendly world syndrome. This change might have many positive effects and even reduce some of these effects by making people mindful of the filtering. ((We are investigating this in ongoing experimental research. Also see Schwarz, N., Bless, H., Strack, F., Klumpp, G., Rittenauer-Schatka, H., & Simons, A. (1991). Ease of retrieval as information: Another look at the availability heuristic. Journal of Personality and Social Psychology, 61(2), 195-202. doi:10.1037/0022-3514.61.2.195)) But I don’t think these effects are so easily avoided in any media environment that includes sensible personalization for increased relevance and engagement.
Activity streams, personalization, and beliefs about our social neighborhood
Every person who logs into Facebook is met with the same interface but with personalized content. This interface is News Feed, which lists “news stories” generated by users’ Facebook friend. These news stories include the breaking news that Andrew was just tagged in a photo, that Neema declared he is a fan of a particular corporation, that Ellen joined a group expressing support for a charity, and that Alan says, “currently enjoying an iced coffee… anyone want to see a movie tonight?”
News Feed is an example of a particular design pattern that has recently become quite common – the activity stream. An activity stream aggregates actions of a set of individuals – such as a person’s egocentric social network – and displays the recent and/or interesting ones.
I’ve previously analysed, in a more fine-grained analysis of a particular (and now changed) interface element for setting one’s Facebook status message, how activity streams bias our beliefs about the frequency of others’ participation on social network services (SNSs). It works like this:
- We use availability to mind as a heuristic for estimating probability and frequency (Kahneman & Tversky, 1973). So if it is easier to think of a possibility, we judge it to be more likely or frequent. This heuristic is often helpful, but it also leads to bias due to, e.g., recent experience, search strategy (compare thinking of words starting with ‘r’ versus words with ‘r’ as the third letter).
- Activity streams show a recent subset of the activity available (think for now of a simple activity stream, like that on one’s Twitter home page).
- Activity streams show activity that is more likely to be interesting and is more likely to have comments on it.
Through the availability heuristic (and other mechanisms) this leads to one to estimate that (1) people in one’s egocentric network are generating activity on Facebook more frequently than they actually are and (2) stories with particular characteristics (e.g., comments on them) are more (or less) common in one’s egocentric network than they actually are.
Personalized cultivation
When thinking about this in the larger picture, one can see this as a kind of cultivation effect of algorithmic selection processes in interpersonal media. According to cultivation theory (see Williams, 2006, for an application to MMORGs), our long-term exposure to media makes leads us to see the real world through the lens of the media world; this exposure gradually results in beliefs about the world based on the systematic distortions of the media world (Gerbner et al., 1980). For example, heavy television viewing predicts giving more “television world” answers to questions — overestimating the frequency of men working in law enforcement and the probability of experiencing violent acts. A critical difference here is that with activity streams, similar cultivation can occur with regard to our local social and cultural neighborhood.
Aims of personalization
Automated personalization has traditionally focused on optimizing for relevance – keep users looking, get them clicking for more information, and make them participate related to this relevant content. But the considerations here highlight another goal of personalization: personalization for strategic influence on attitudes that matter for participation. These goals can be in tension. For example, should the system present…
The most interesting and relevant photos to a user?
Showing photographs from a user’s network that have many views and comments may result in showing photos that are very interesting to the user. However, seeing these photos can lead to inaccurate beliefs about how common different kinds of photos are (for example, overestimating the frequency of high-quality, artistic photos and underestimating the frequency of “poor-quality” cameraphone photos). This can discourage participation through perceptions of the norms for the network or the community.
On the other hand, seeing photos with so many comments or views may lead to overestimating how many comments one is likely to get on one’s own photo; this can result in disappointment following participation.
Activity from a user’s closest friends?
Assume that activity from close friends is more likely to be relevant and interesting. It might even be more likely to prompt participation, particularly in the form of comments and replies. But it can also bias judgments of likely audience: all those people I don’t know so well are harder to bring to mind as is, but if they don’t appear much in the activity stream for my network, I’m less likely to consider them when creating my content. This could lead to greater self-disclosure, bad privacy experiences, poor identity management, and eventual reduction in participation.
References
Gerbner, G., Gross, L., Morgan, M., & Signorielli, N. (1980). The “Mainstreaming” of America: Violence Profile No. 11. Journal of Communication, 30(3), 10-29.
Kahneman, D., & Tversky, A. (1973). Availability: A heuristic for judging frequency and probability. Cognitive Psychology, 5, 207-232.
Williams, D. (2006). Virtual Cultivation: Online Worlds, Offline Perceptions. Journal of Communication, 56, 69-87.